Logging & Monitoring
Fynd Boltic MCP offers powerful observability features to help you track, and debug MCP requests. With real-time metrics and structured logs, users can quickly identify issues, analyze performance trends, and ensure smooth operation of services.
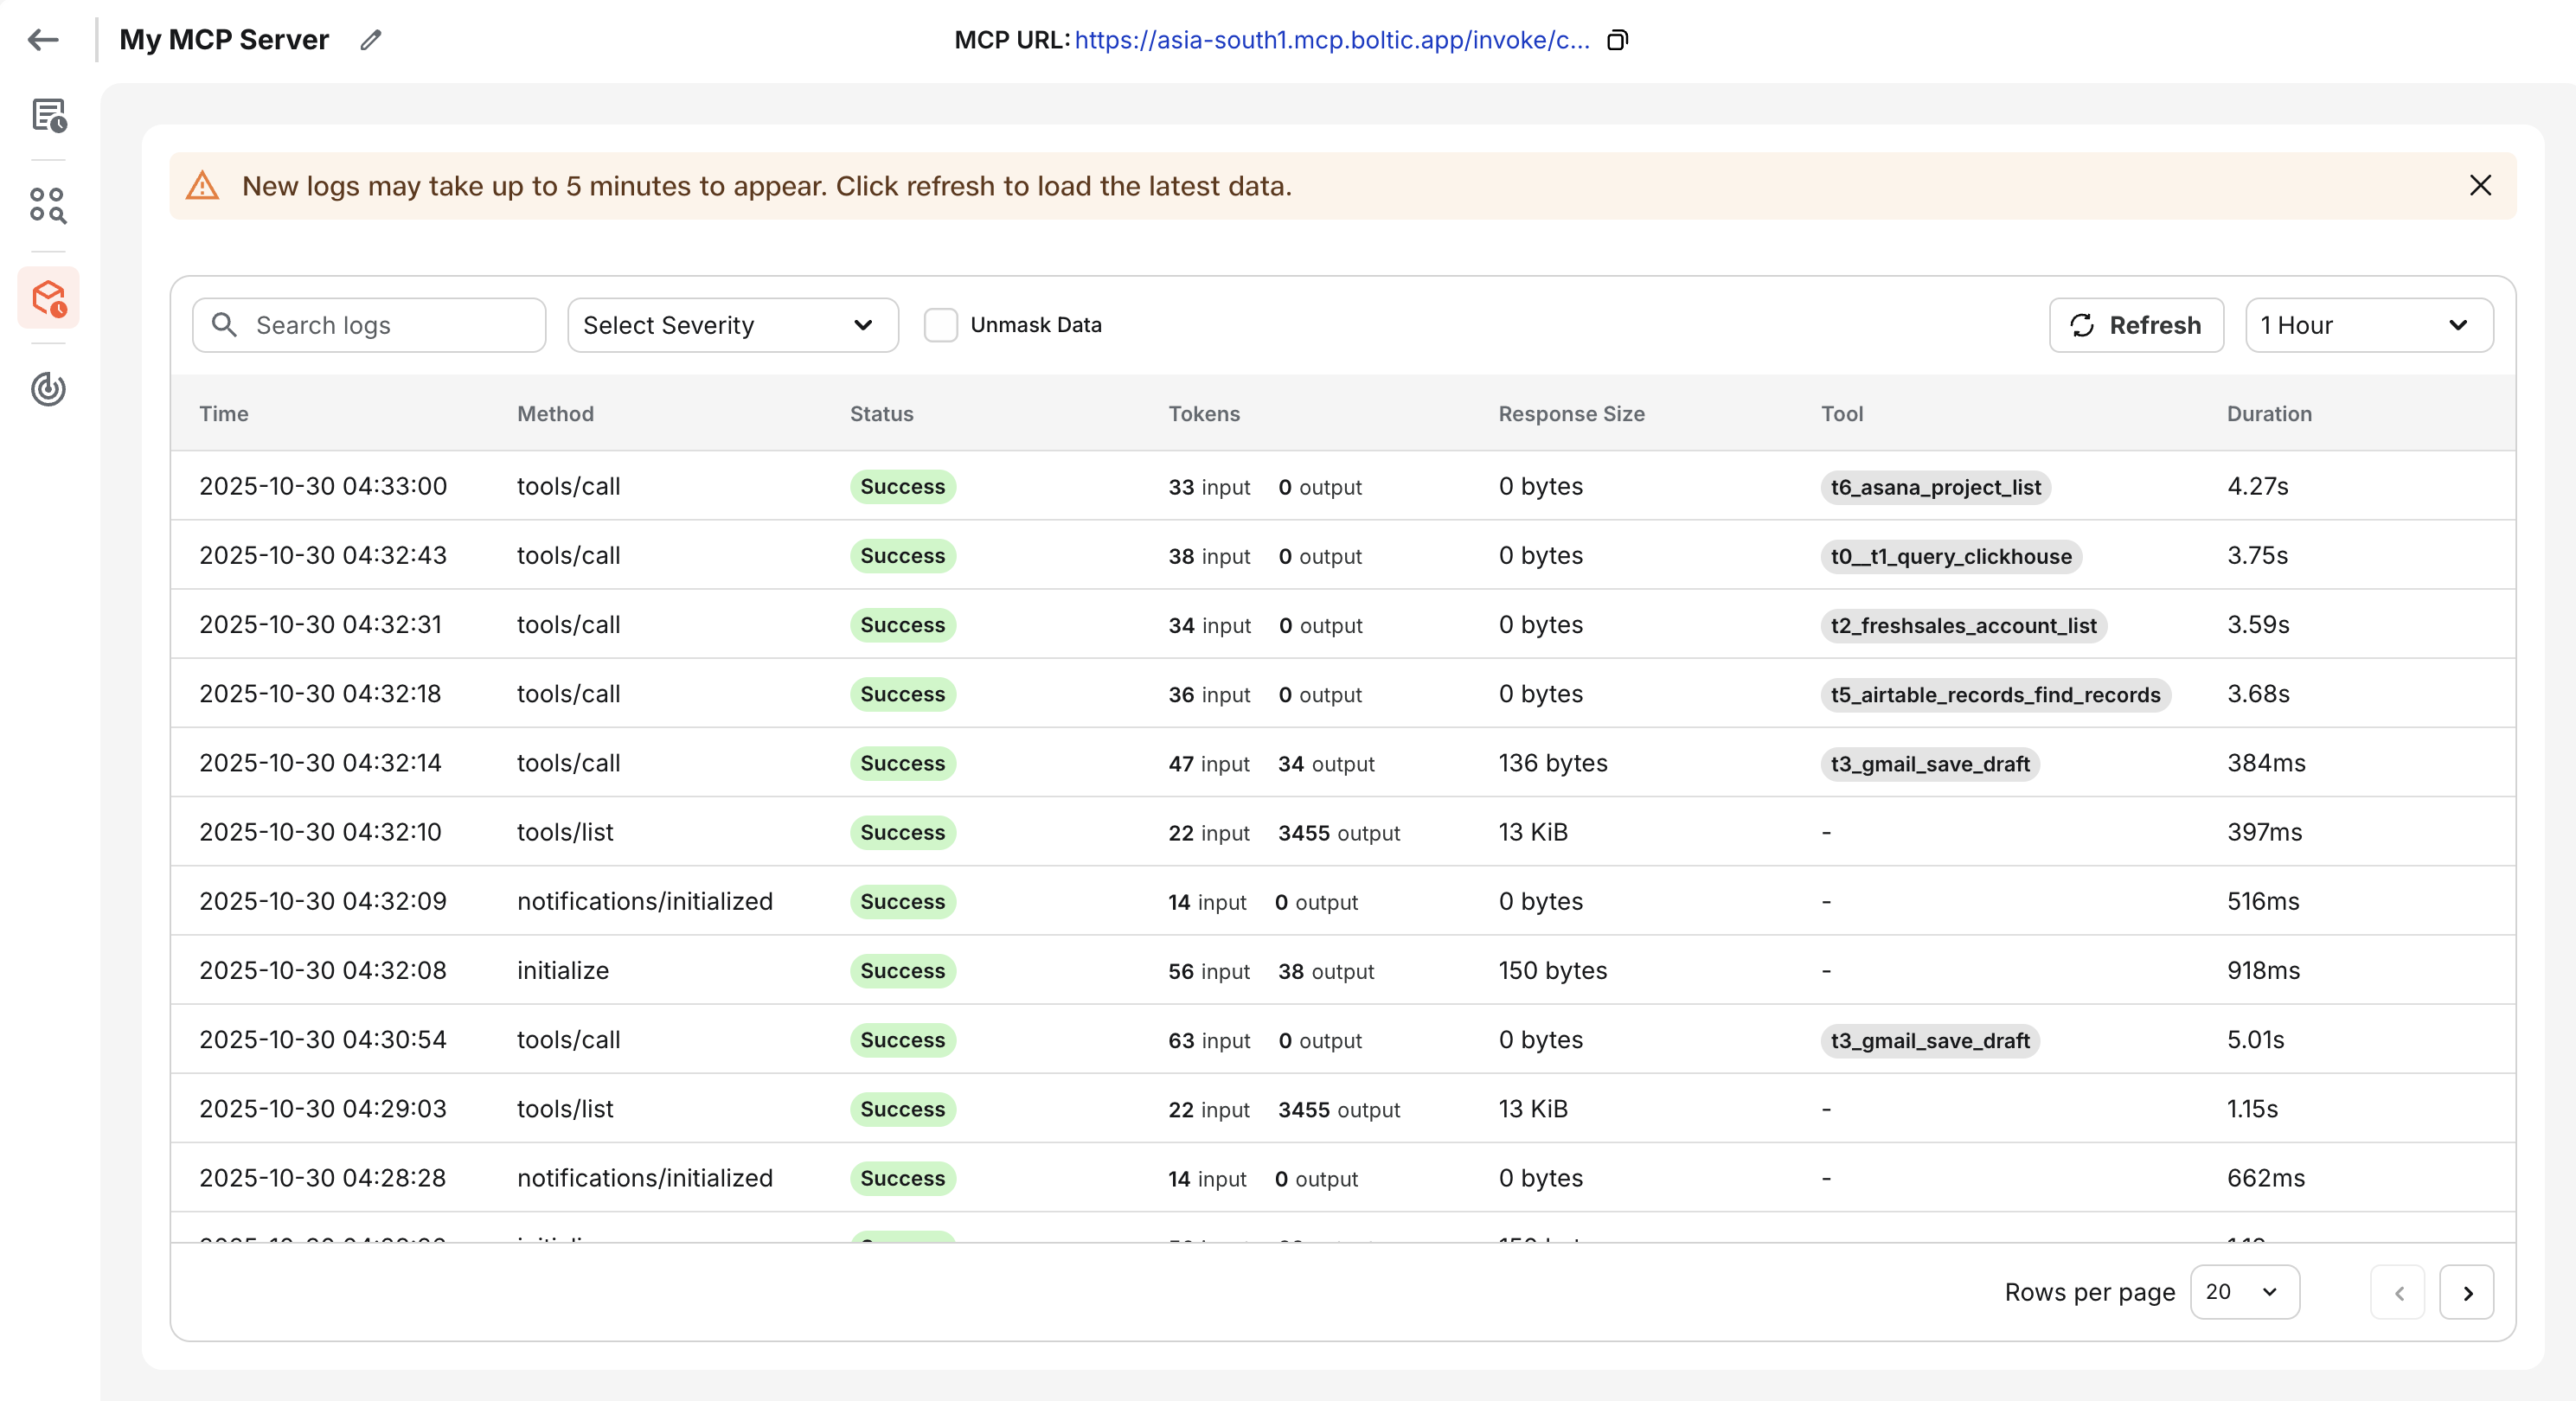
Request Logs
-
Log Availability: Logs are retained and made accessible with a typical delay of up to 5 minutes, ensuring near real-time visibility without impacting performance.
-
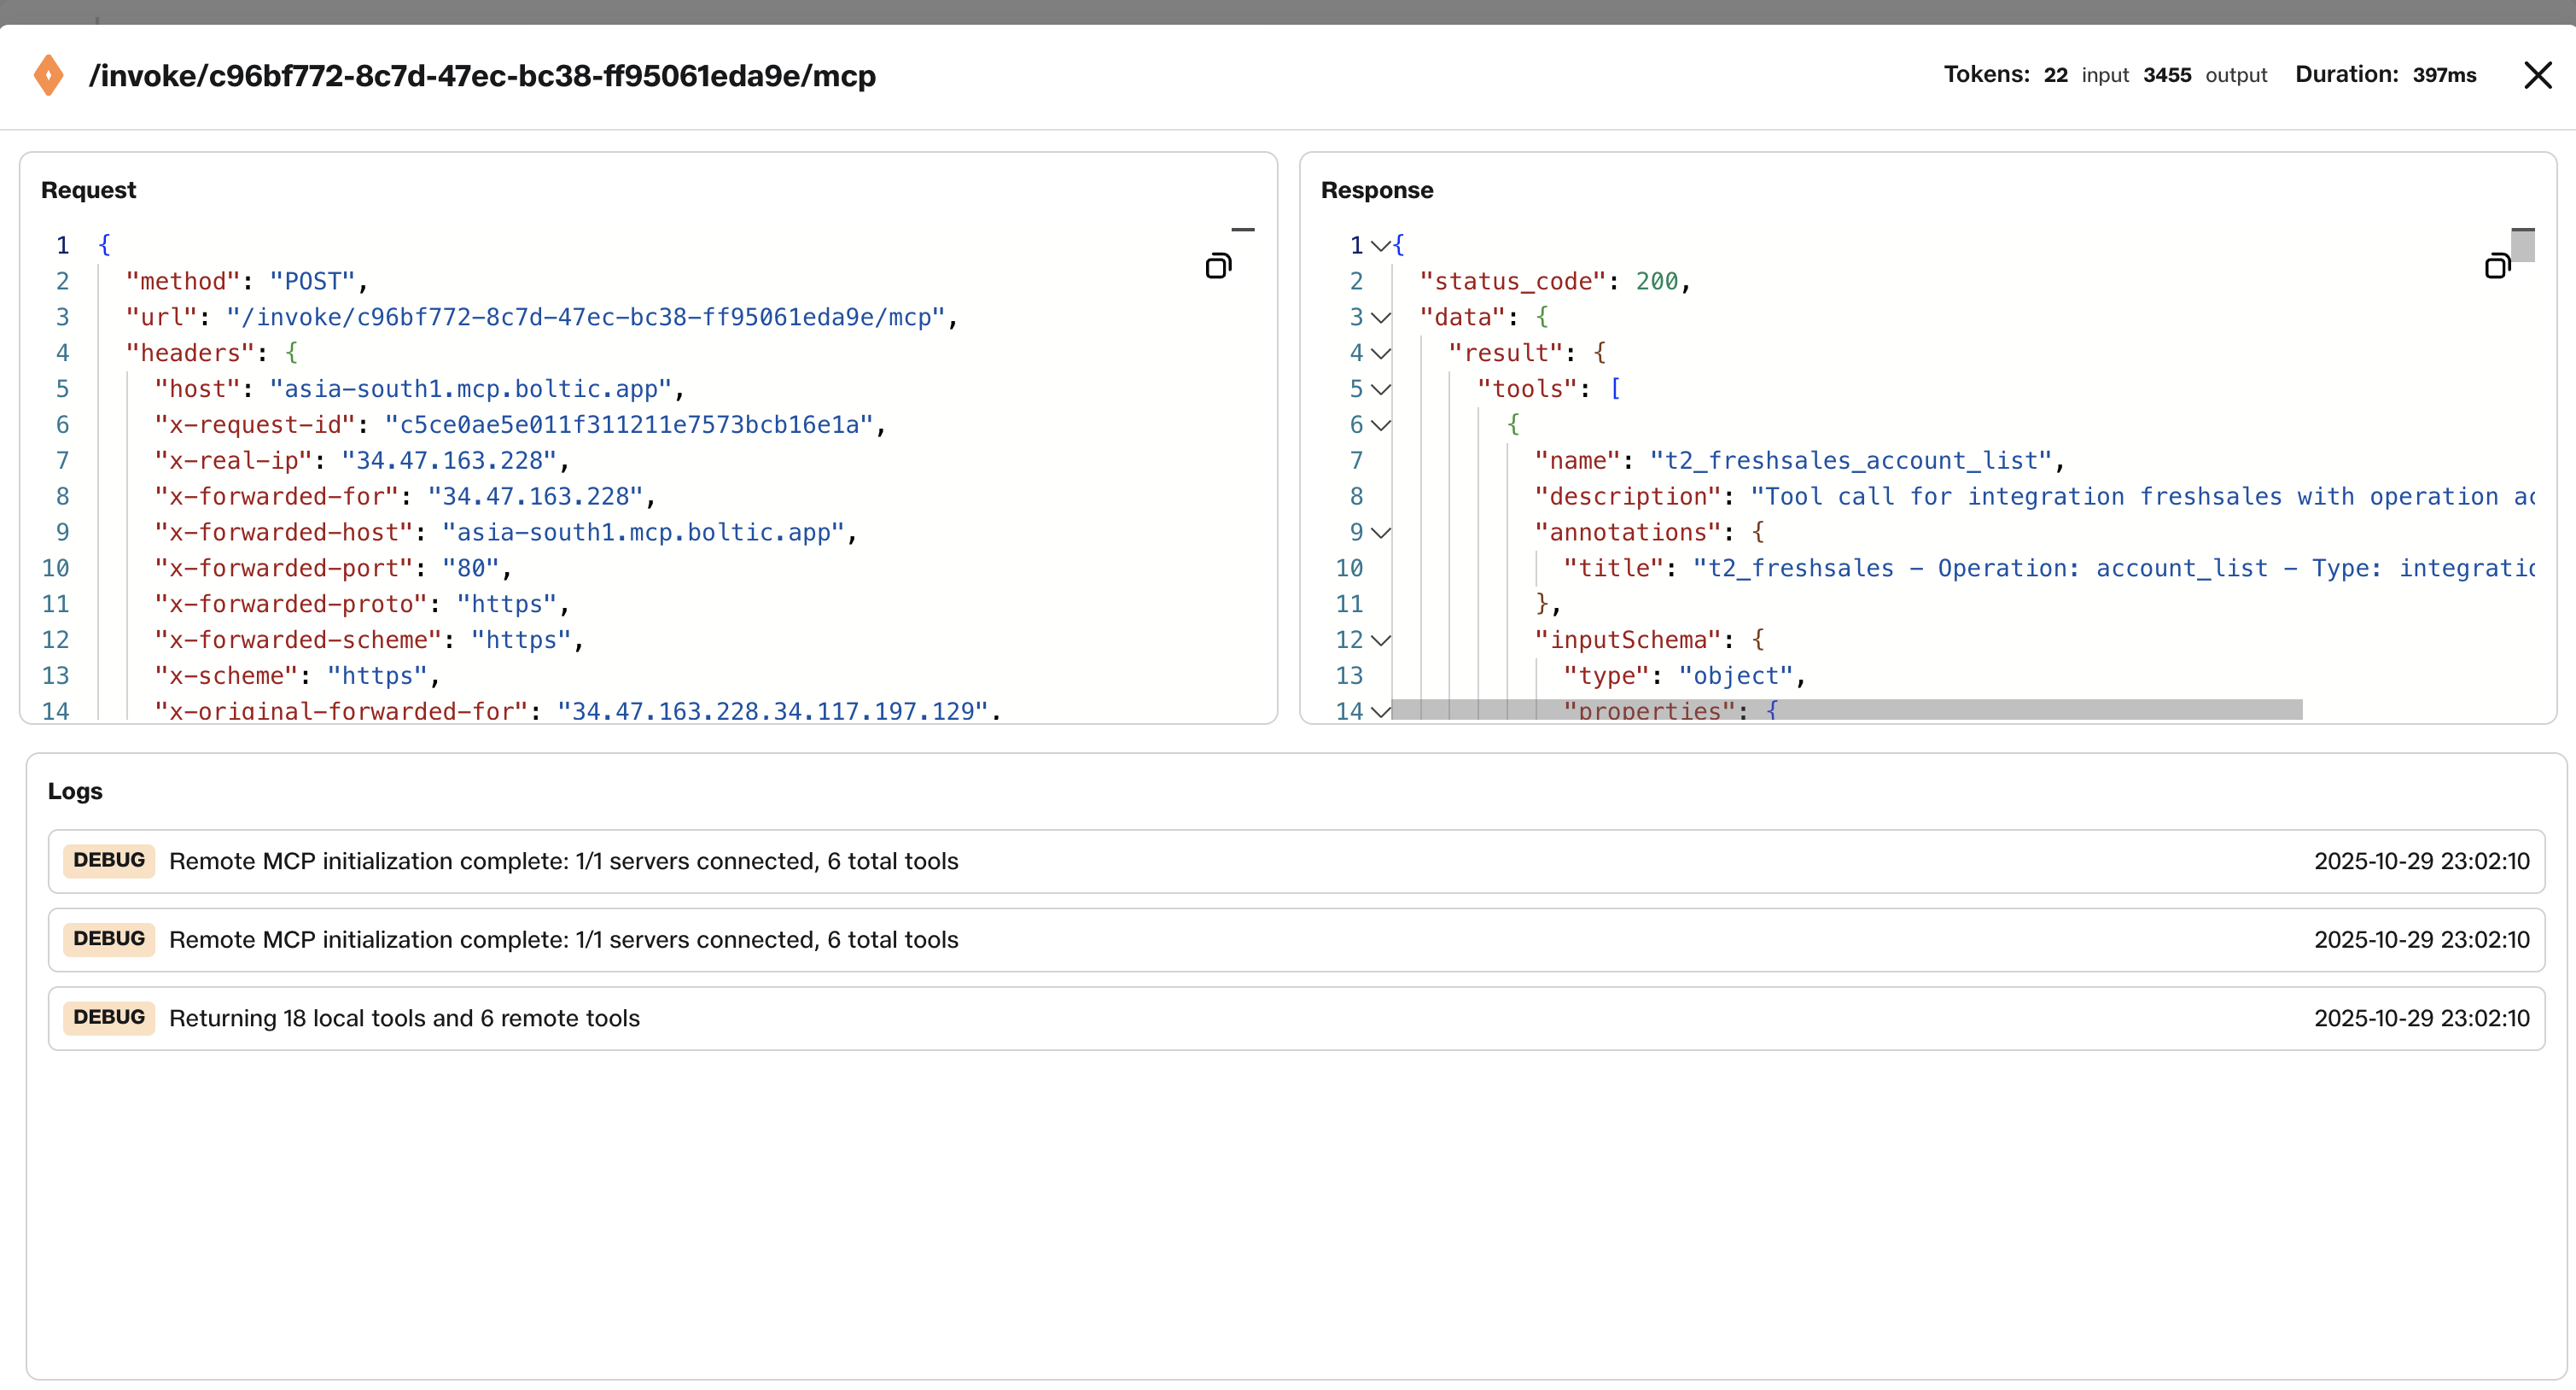
Log Granularity: Every request processed by the MCP server generates a structured execution log that includes:
-
Request ID
-
Method
-
Status
-
Tokens
-
Duration
-
Request and response body
-
-
Log Filtering Options: Logs can be filtered in the dashboard or API using:
- Search – Filter logs by search query.
- Severity – Filter logs by severity levels.
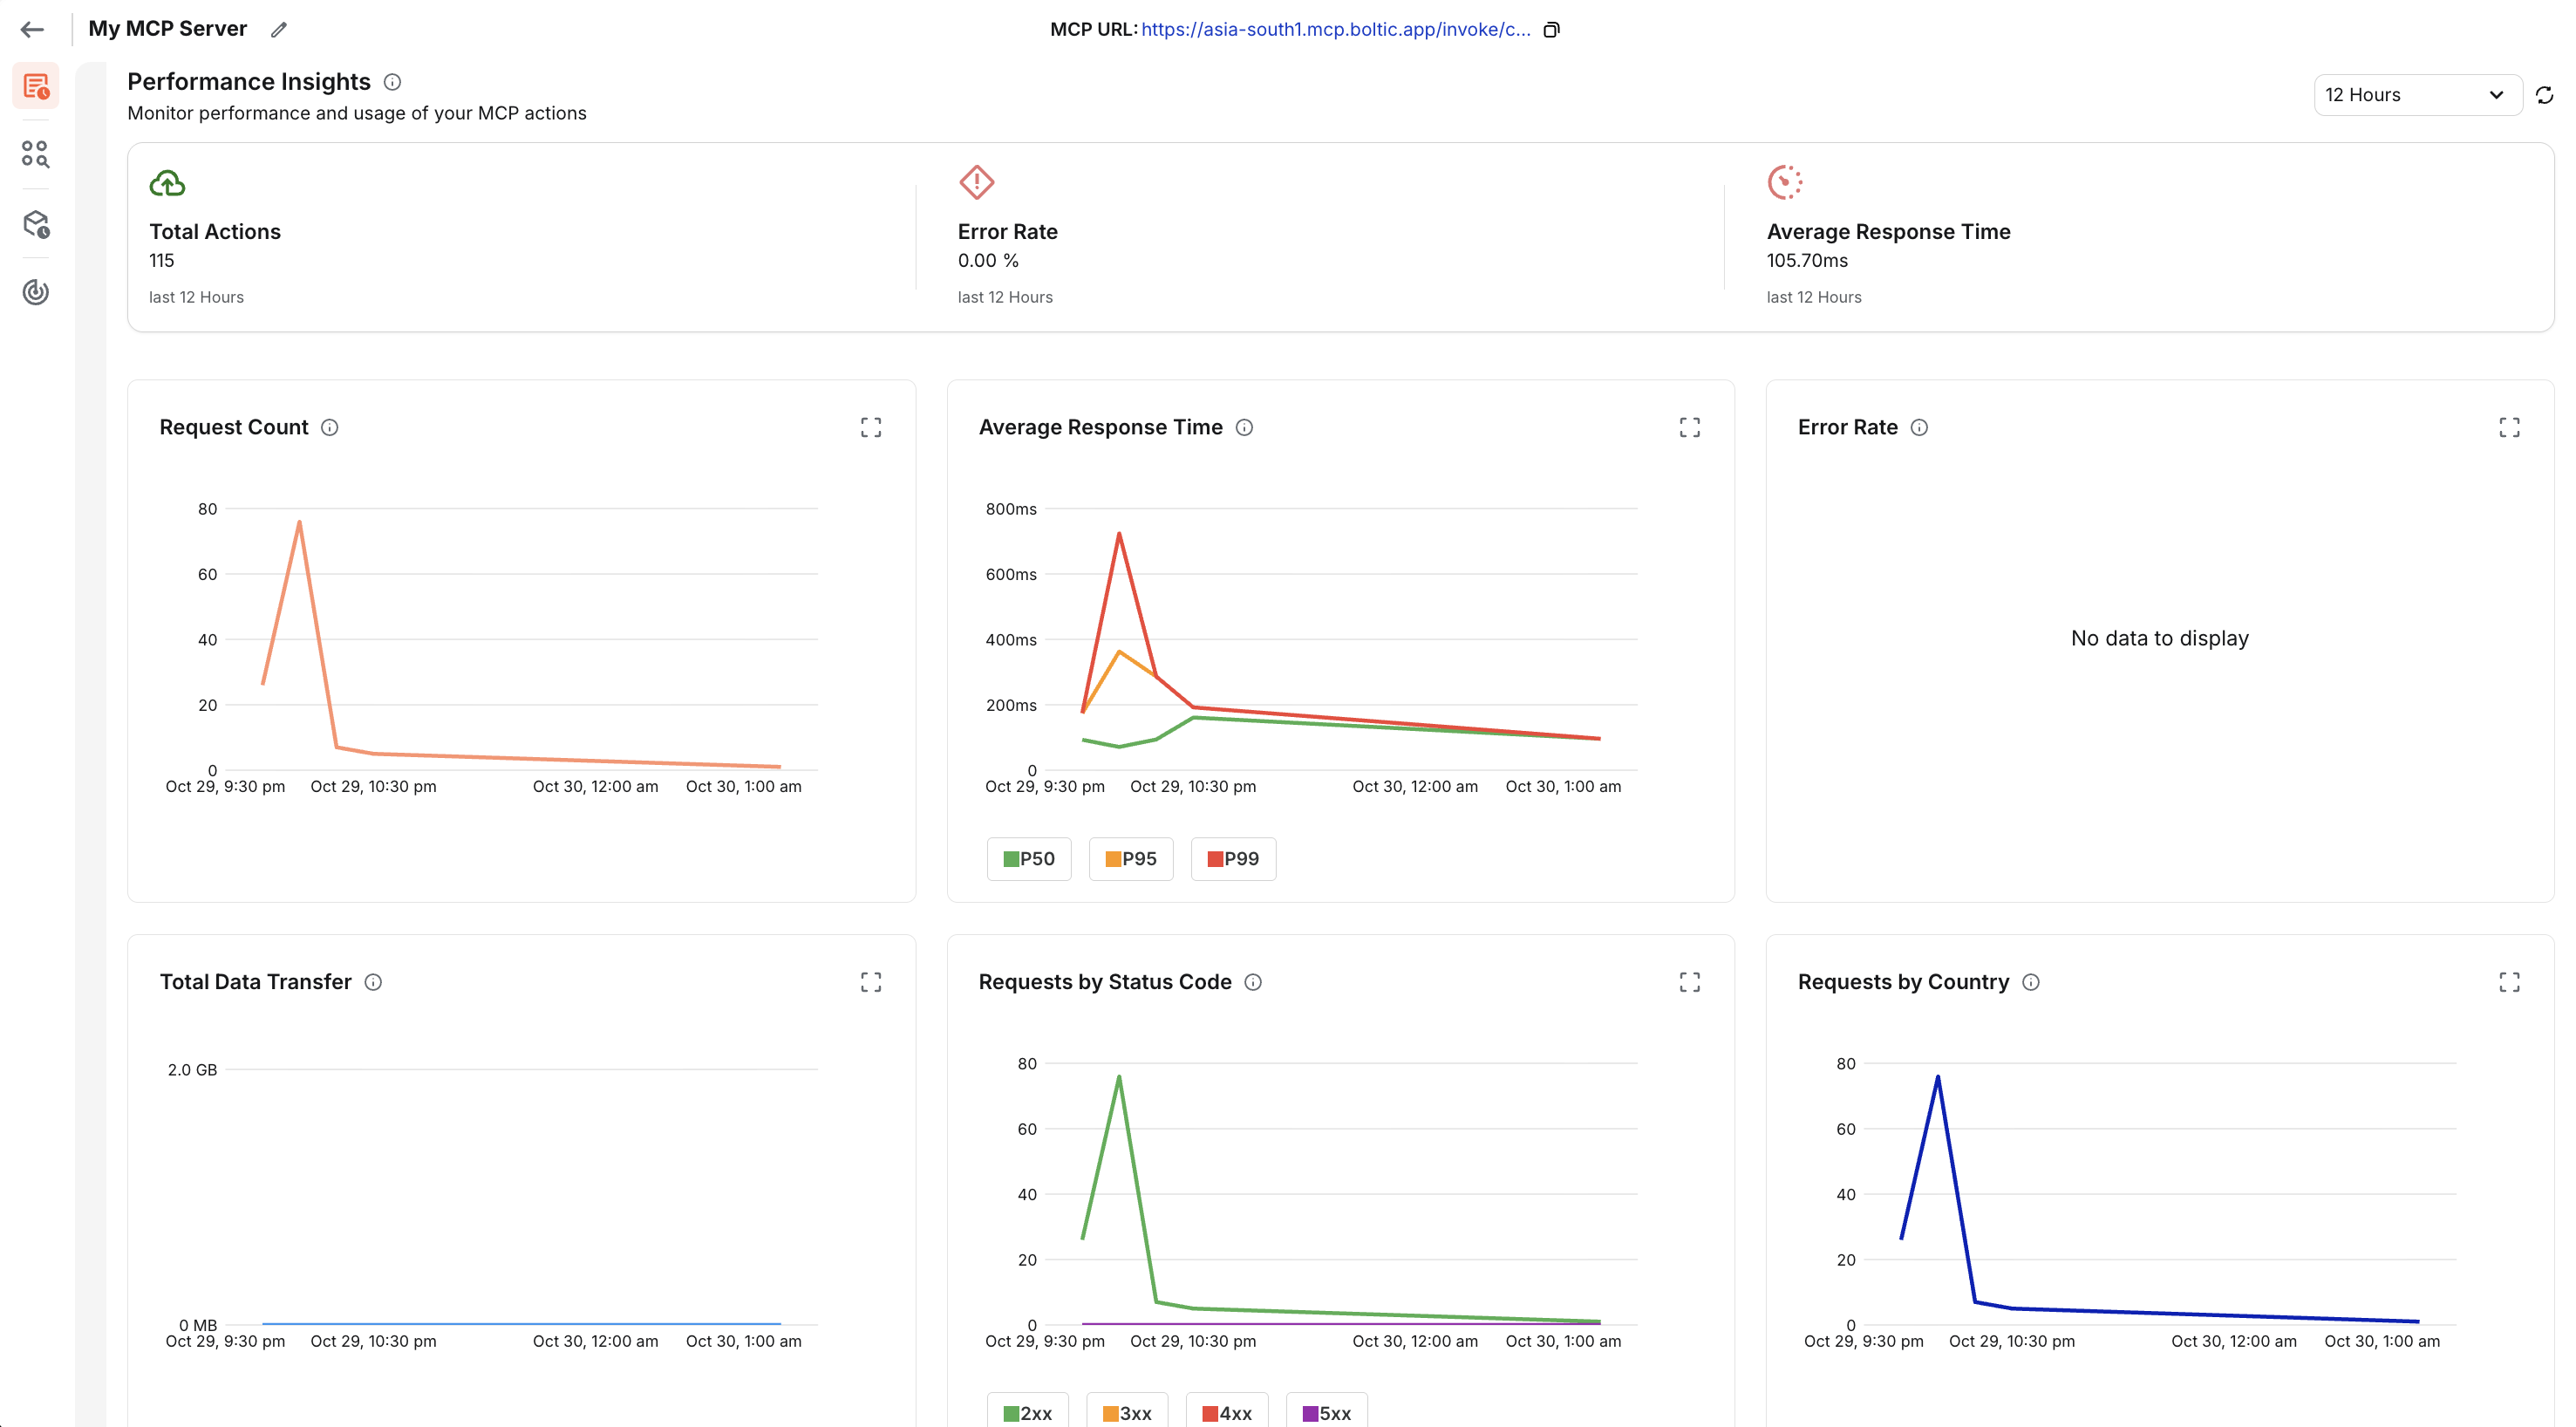
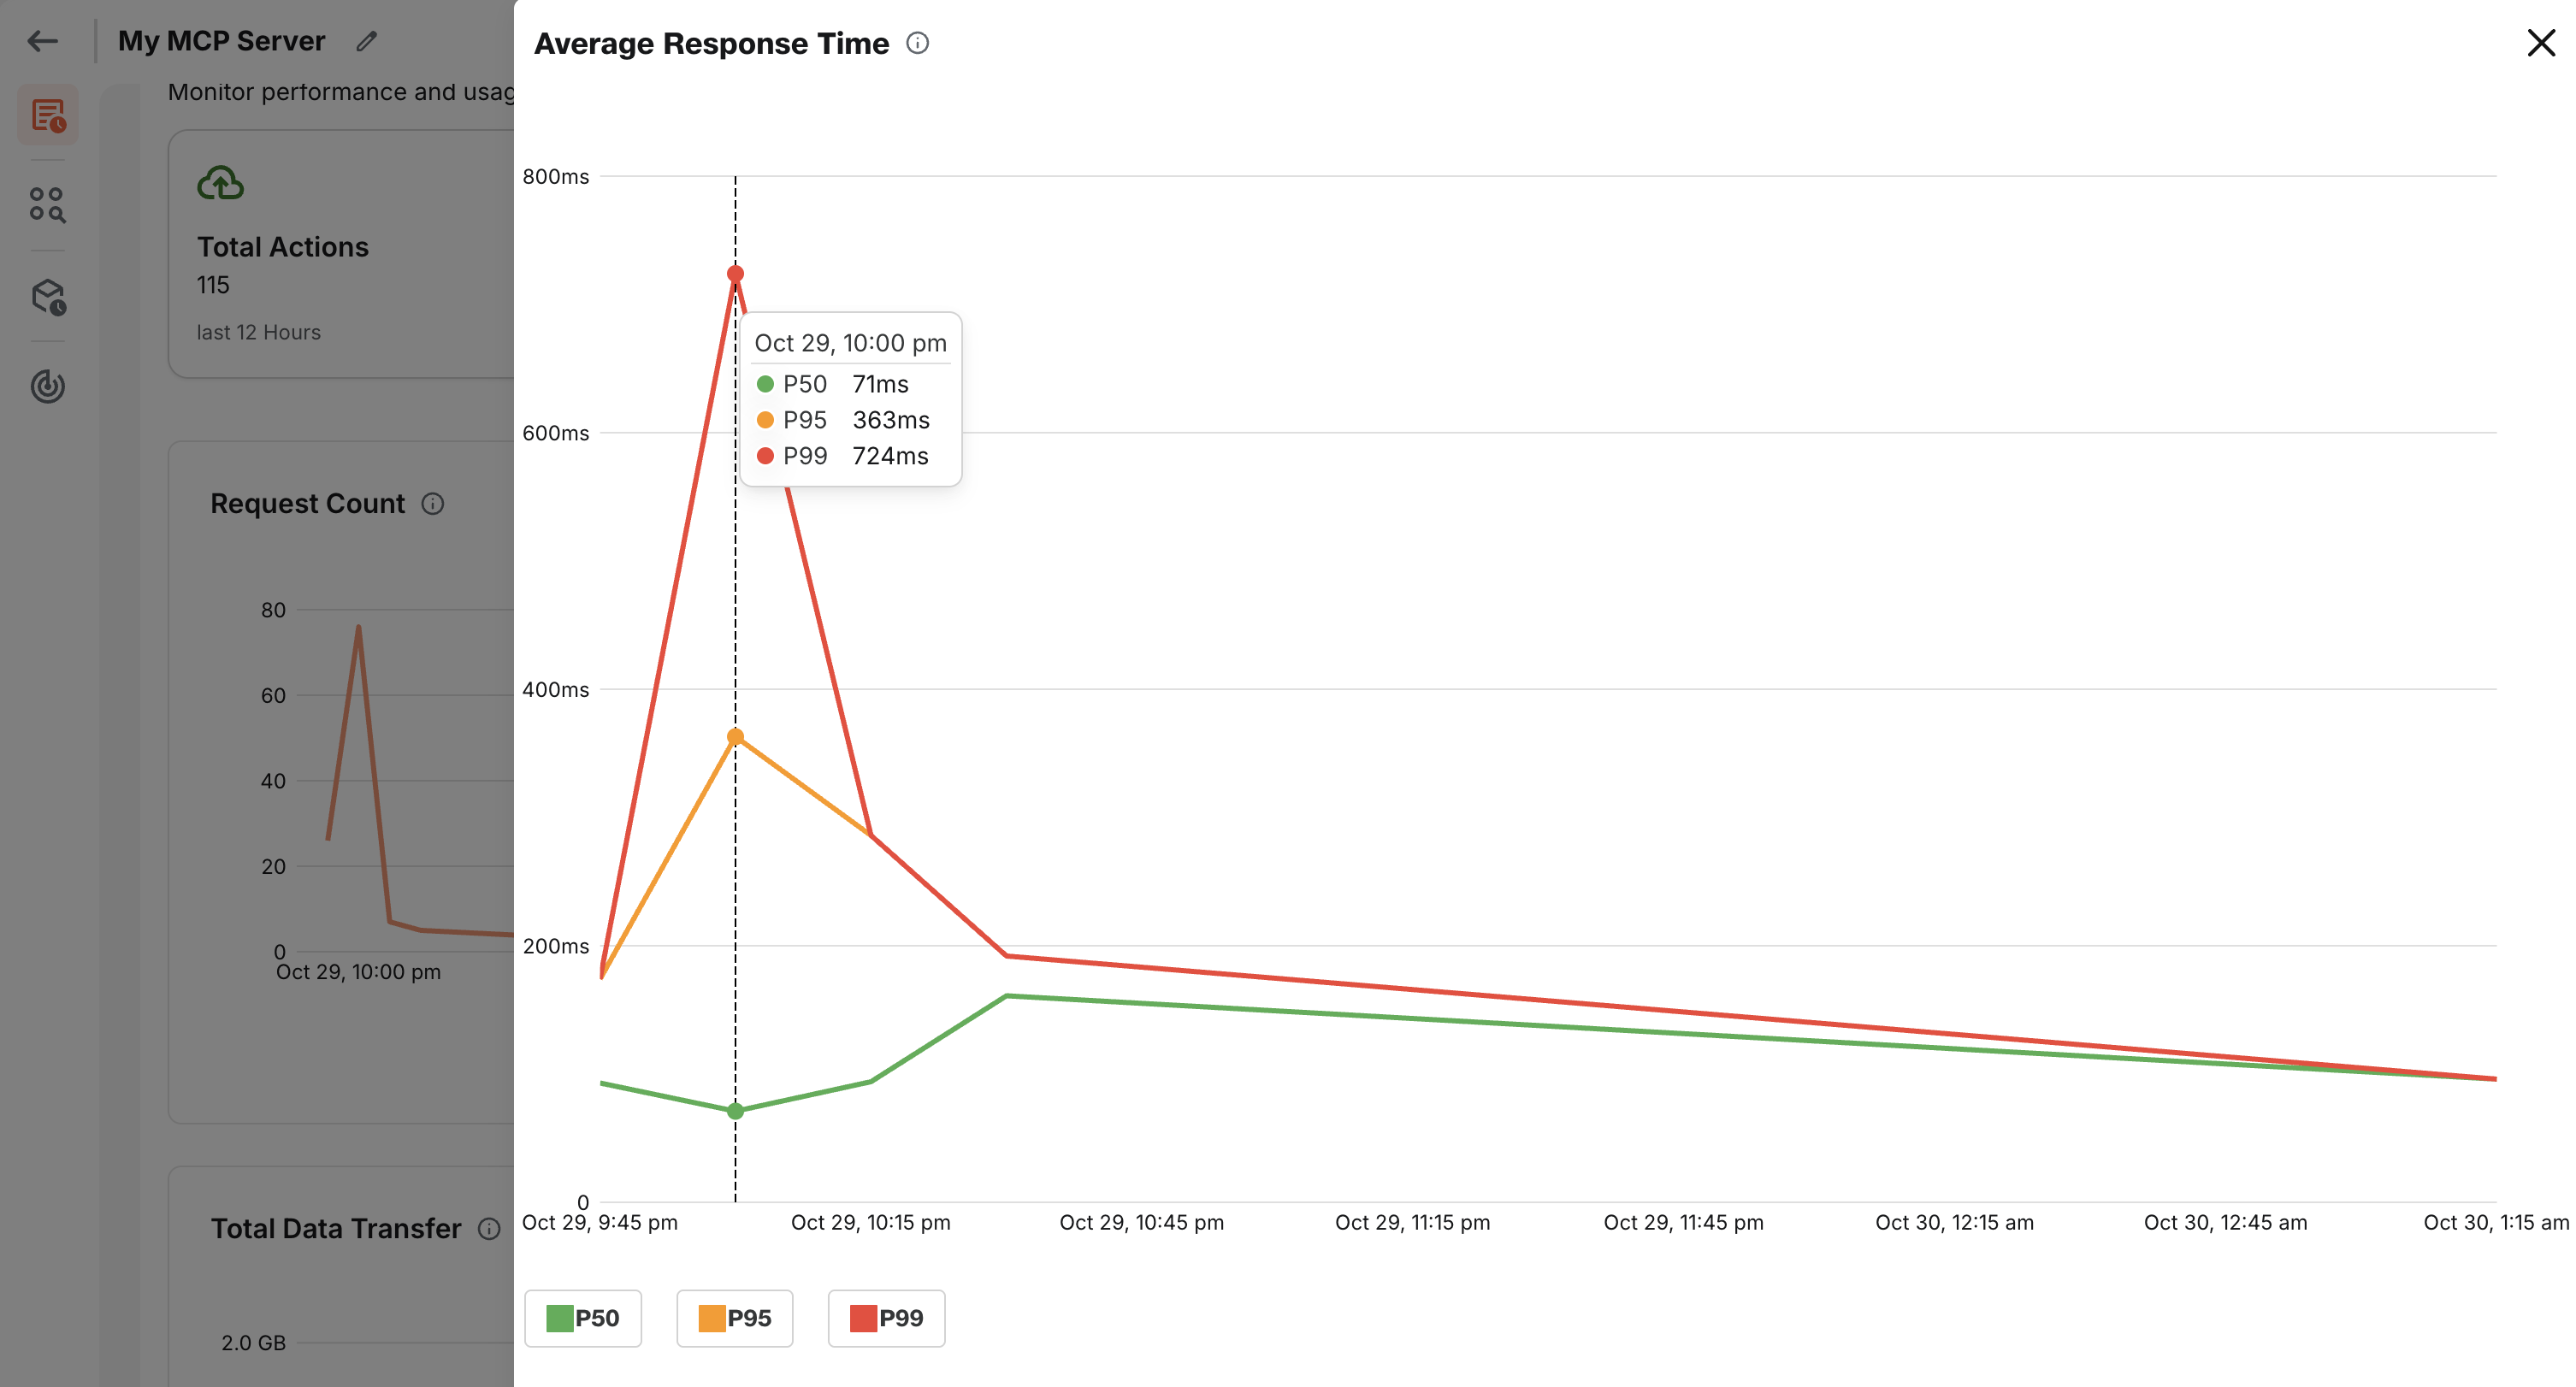
Real-Time Monitoring
Fynd Boltic MCP surfaces actionable metrics to help you understand usage patterns, troubleshoot performance issues, and monitor health of your MCP server.
-
Total Requests – Count of incoming requests over time.
-
Error Rate – Percentage of 4xx/5xx responses across all actions.
-
Average Action Latency – Time spent within Fynd Boltic MCP (excluding downstream latency).
-
Top Actions by Volume – High-traffic actions in your MCP server.
Best Practices
- Regularly audit error rates at the action level to identify failing actions.
- Make sure you have a good understanding of the request and response body for each action.
With its comprehensive logging and monitoring capabilities, Fynd Boltic MCP empowers users to maintain high reliability, diagnose issues fast, and continuously optimize the performance of their MCP servers.