Logs
Boltic MCP offers powerful observability features to track, monitor, and debug MCP requests. Real-time metrics and structured logs enable you to identify issues, analyze performance trends, and maintain reliable MCP server operations. These tools are essential for supporting production environments and effective troubleshooting.
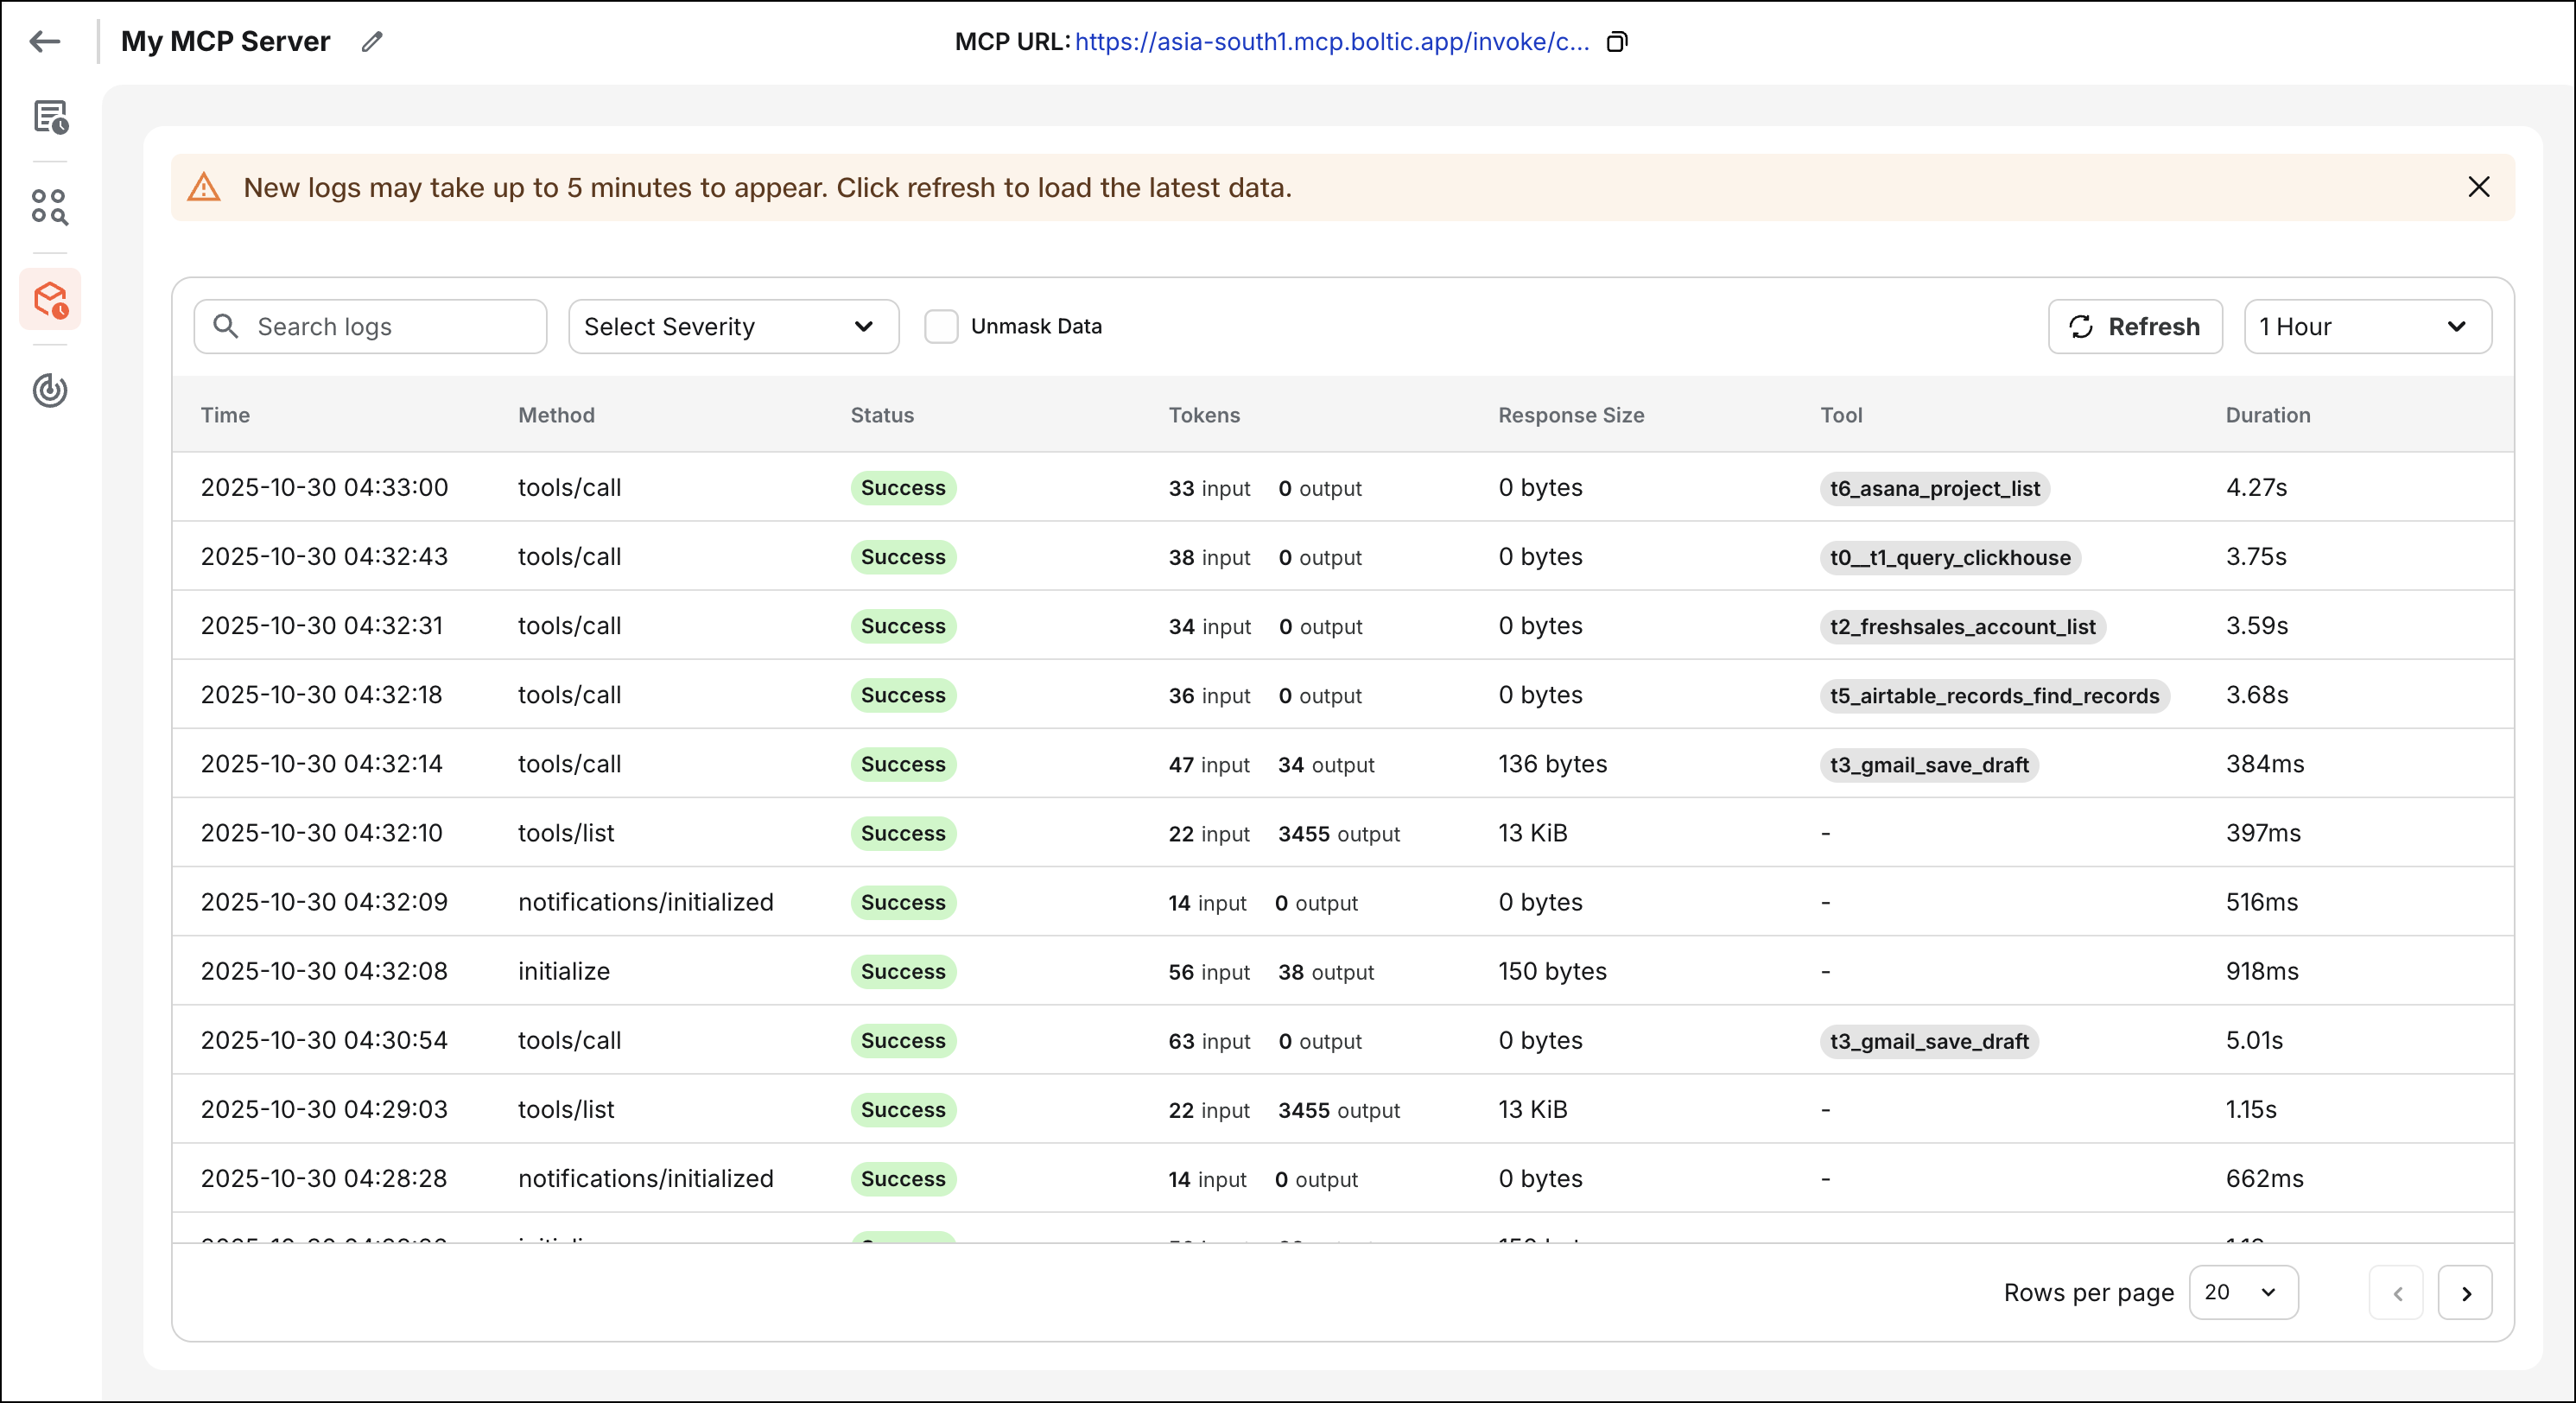
Request Logs
- Log Availability: Logs are retained and typically available within 5 minutes, providing near real-time visibility without affecting performance. This delay supports efficient aggregation and timely insights into MCP server activity.
- Log Granularity:
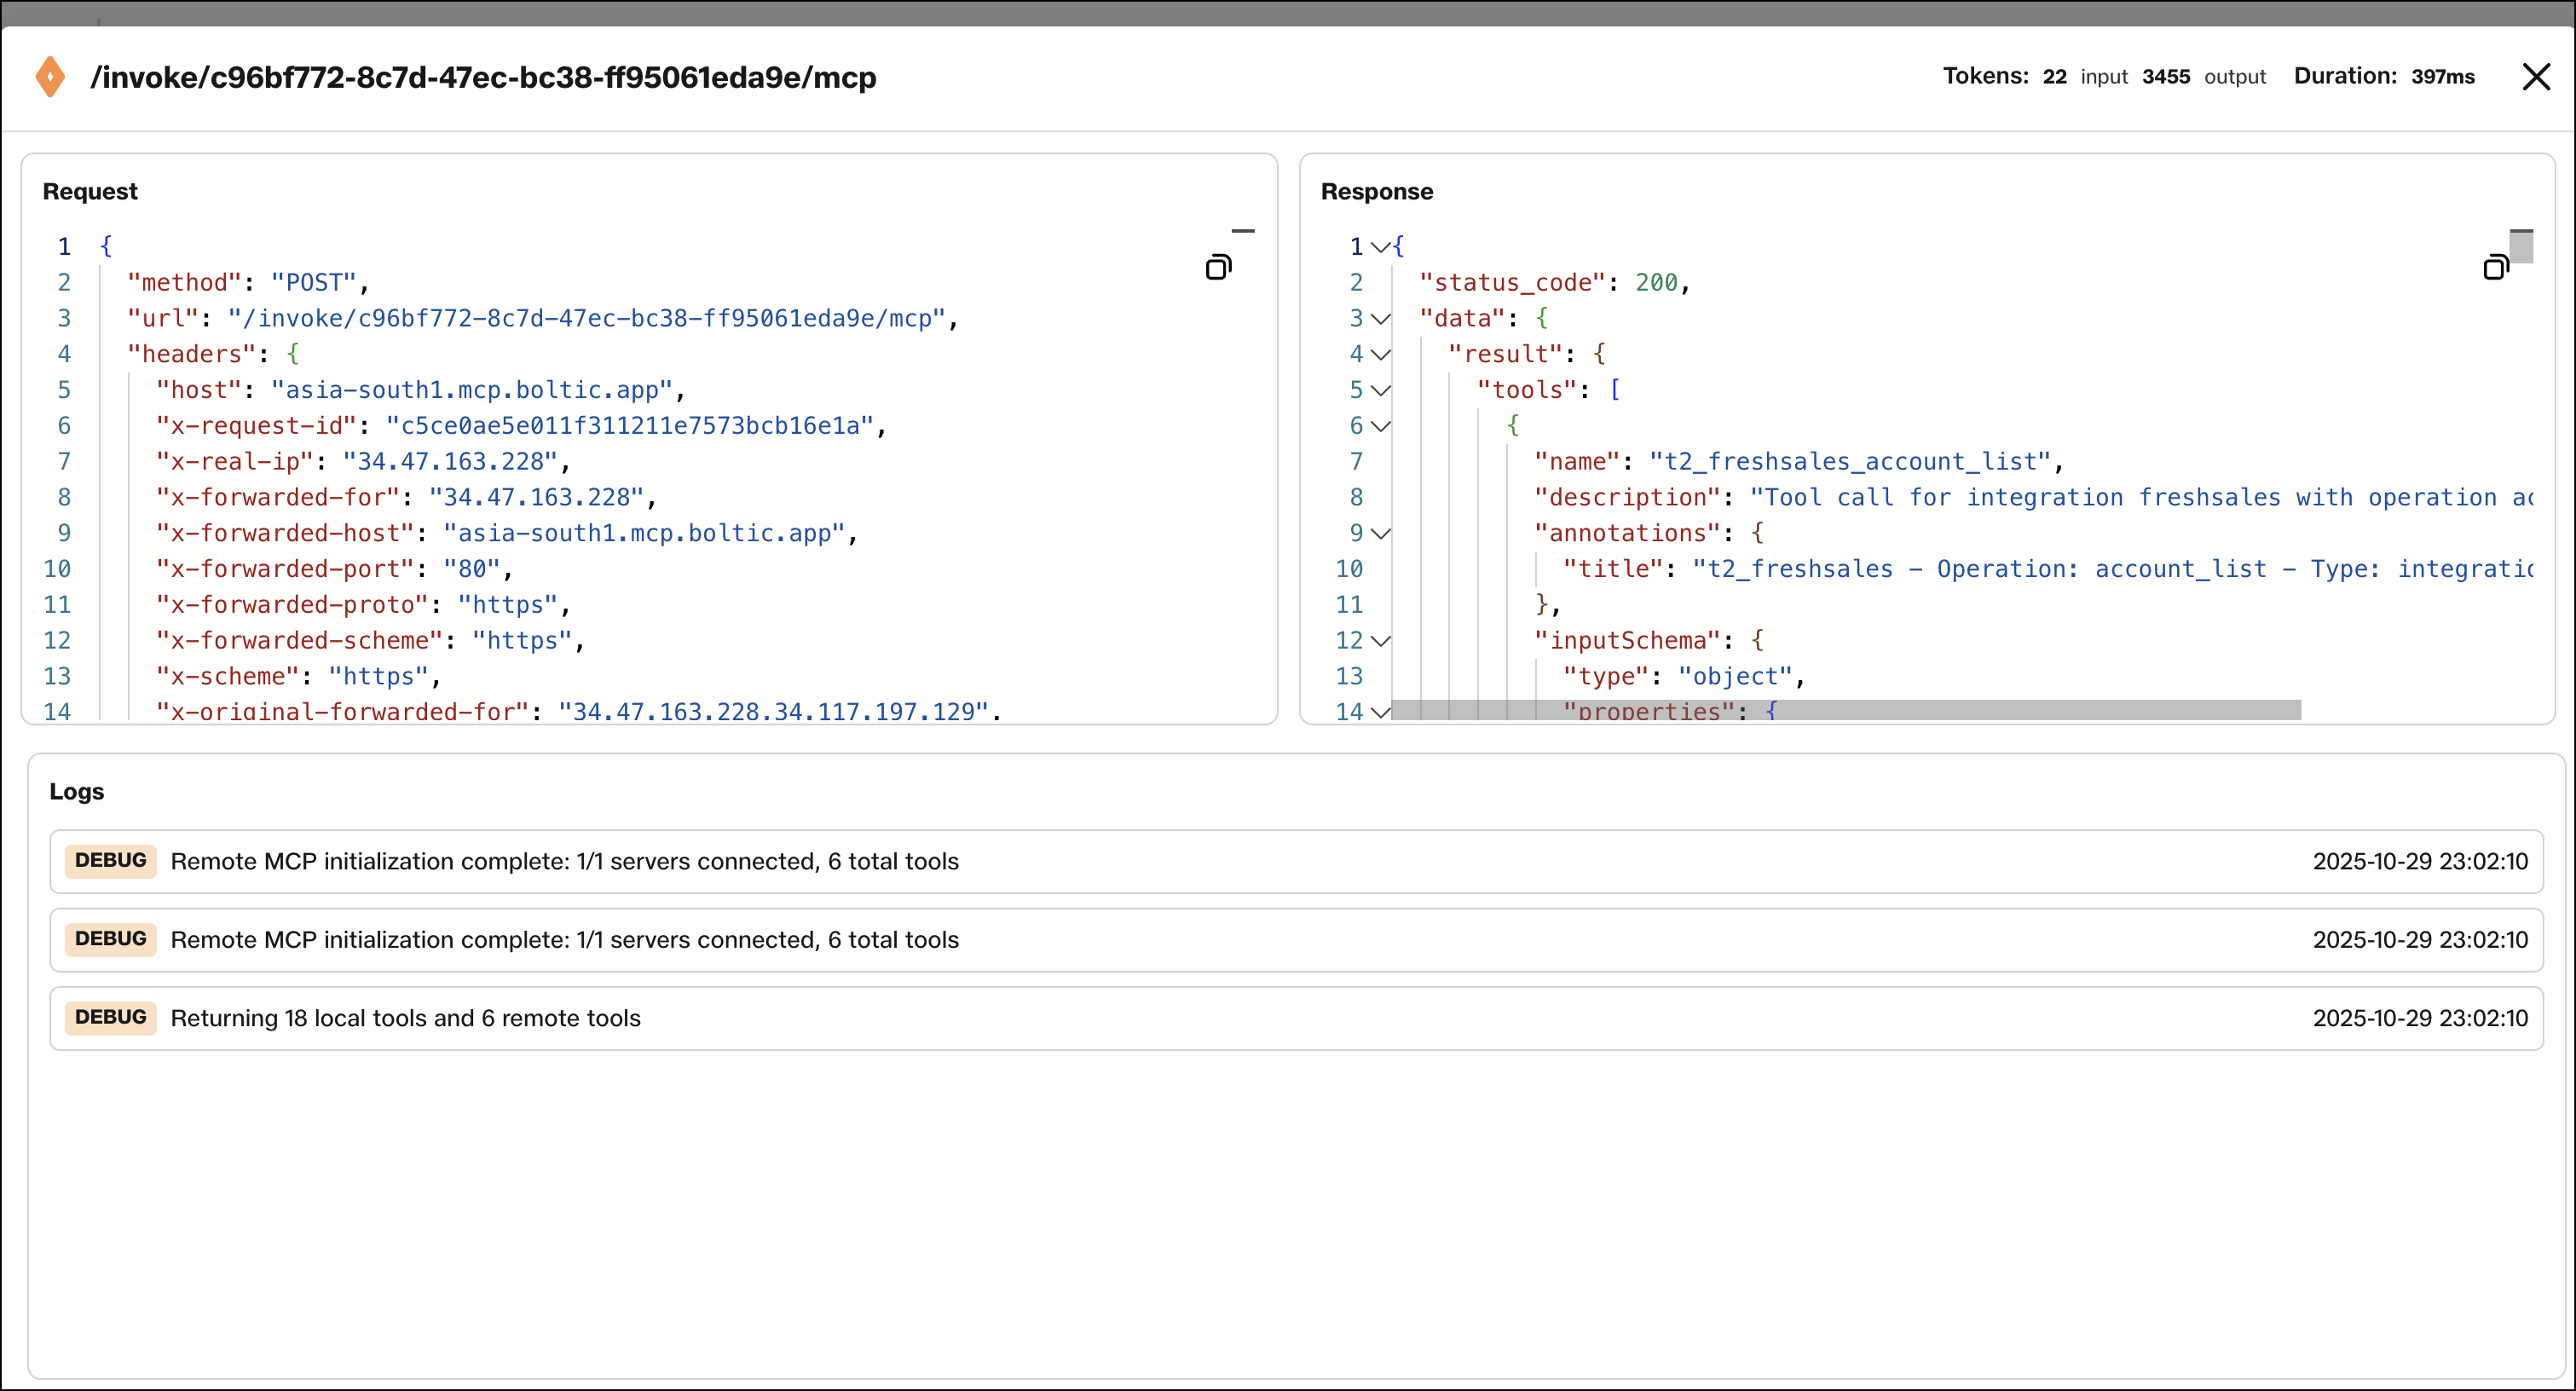
Each MCP server request generates a structured execution log that captures detailed information about the request lifecycle:
- Request ID: Unique identifier for tracking individual requests across systems
- Method: The MCP protocol method invoked (e.g.,
tools/list,tools/call,initialize) - Status: HTTP status code and execution status (success, error, timeout)
- Tokens: Token usage information for AI model interactions (if applicable)
- Duration: Total execution time from request receipt to response delivery
- Request body: Complete request payload including parameters and metadata
- Response body: Complete response payload including results or error details
- Timestamp: Precise timestamp of when the request was processed
- Client information: Details about the client who made the request
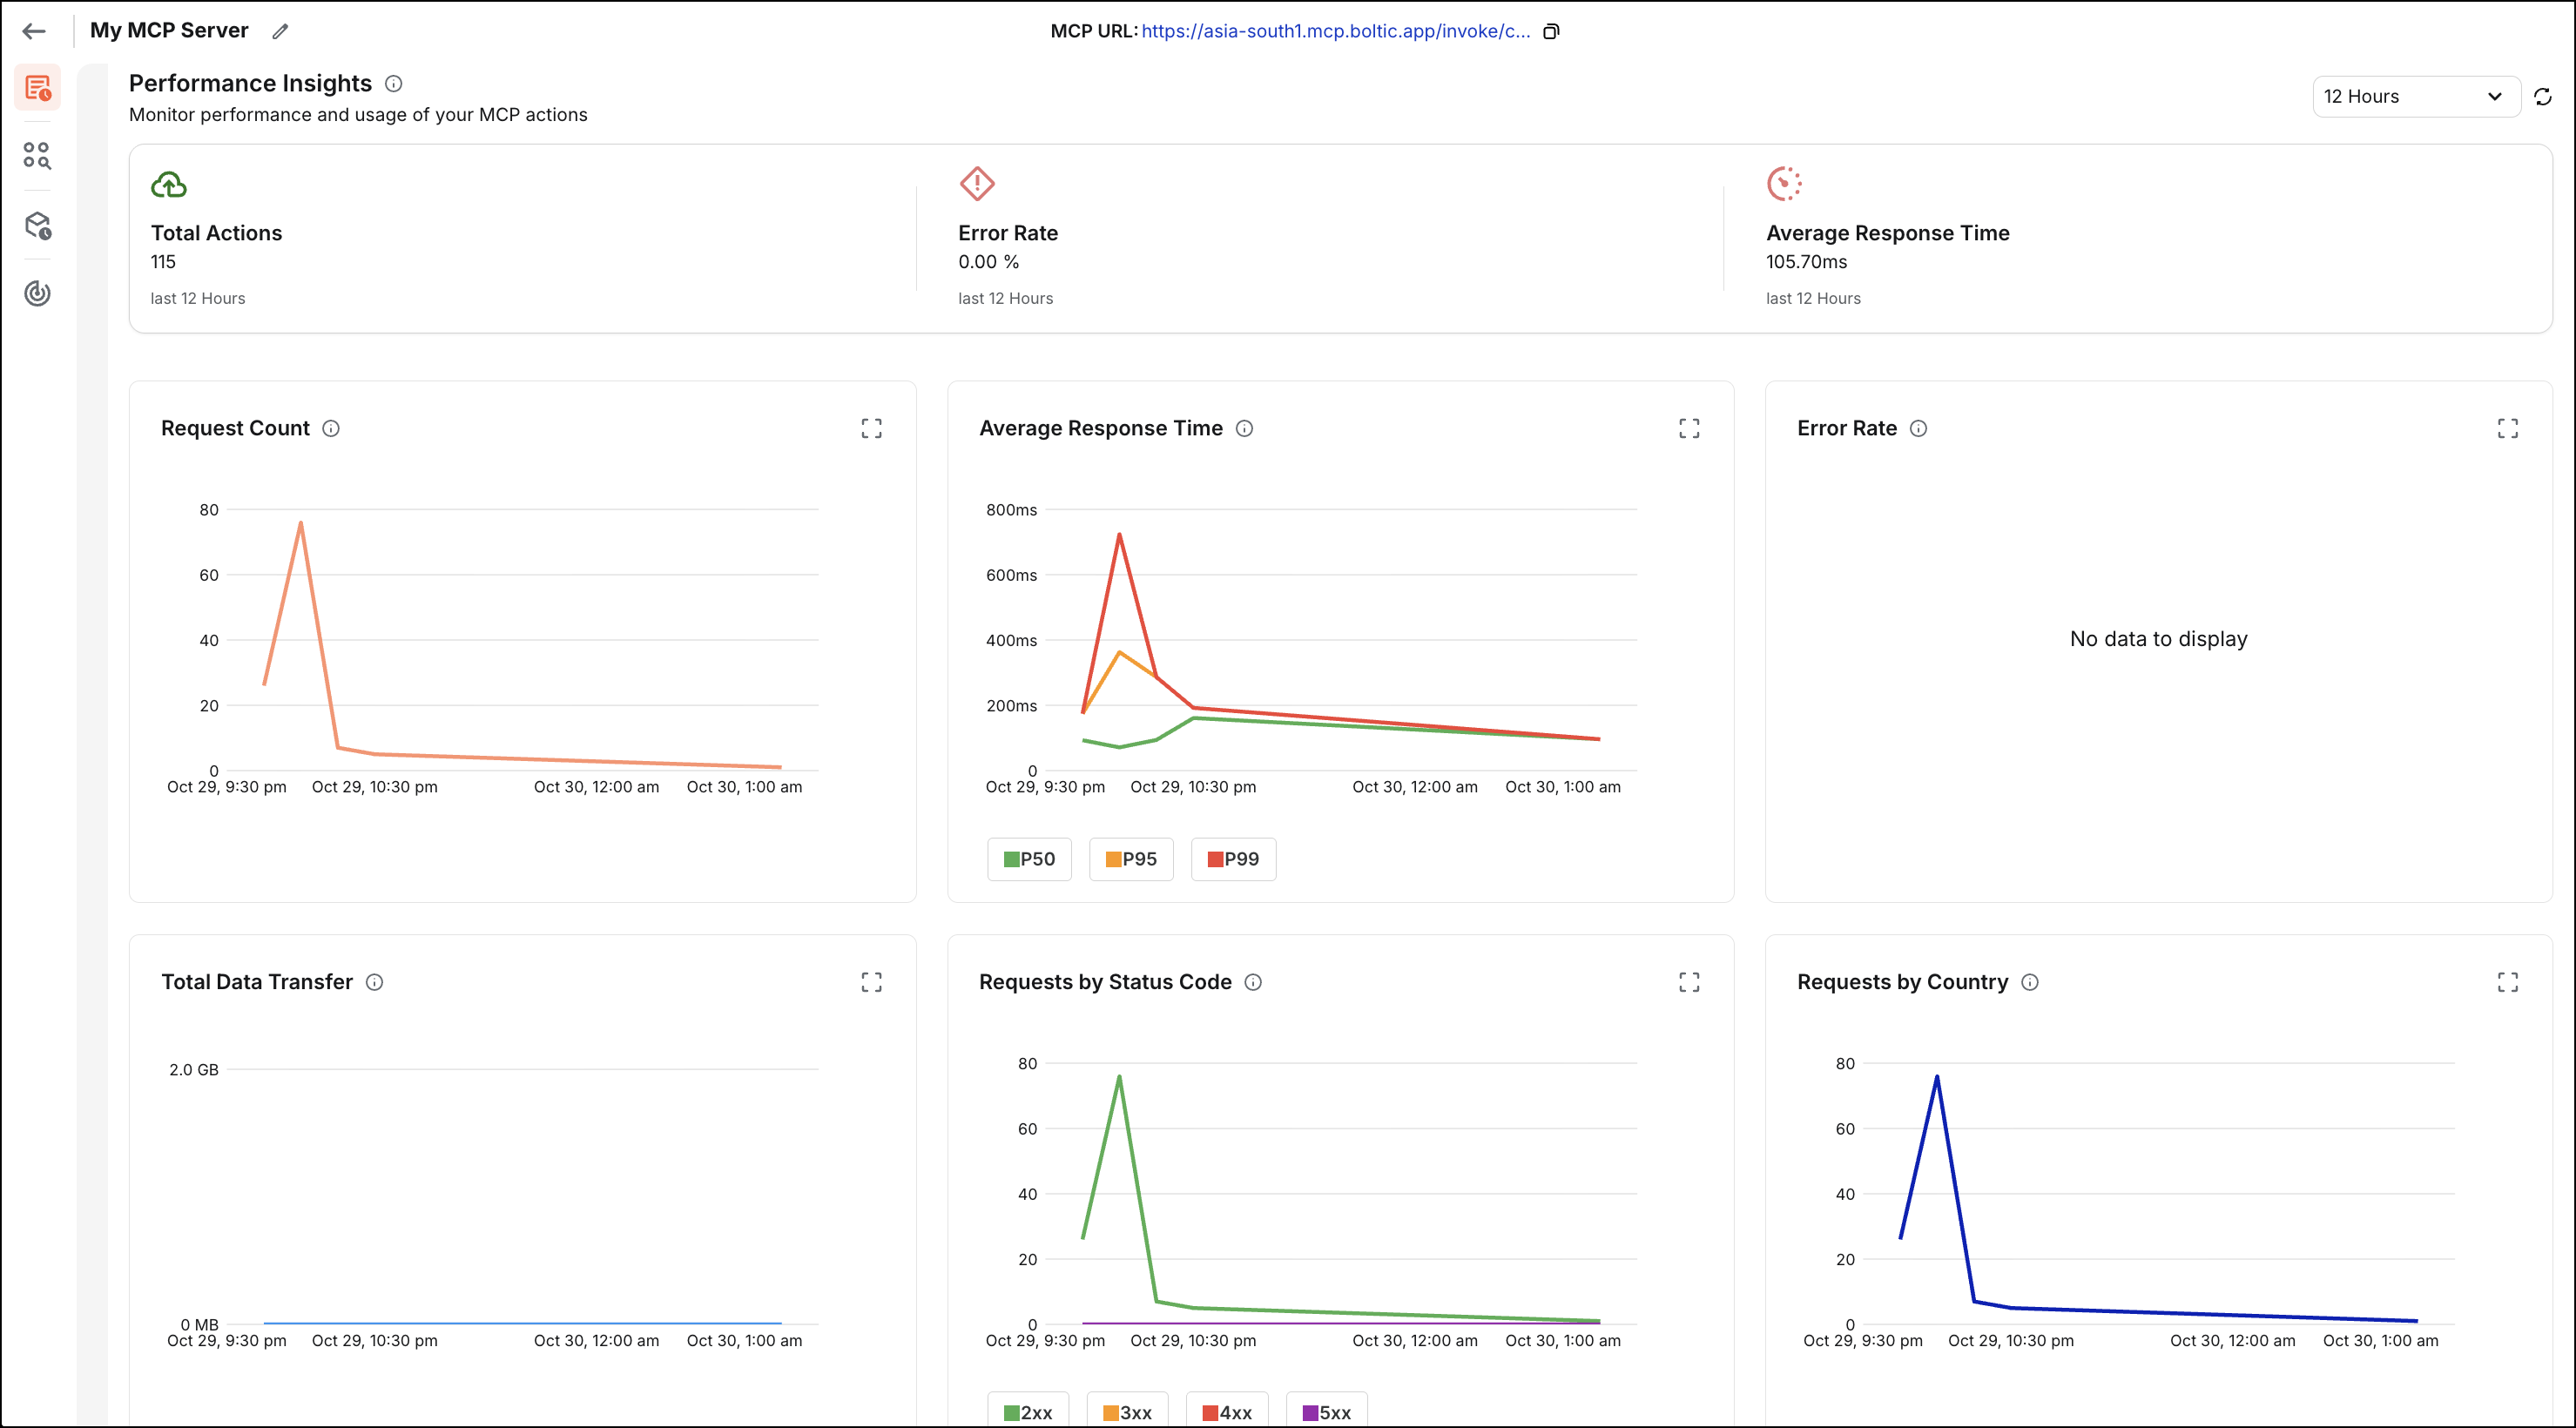
Real-Time Monitoring
Boltic MCP provides actionable metrics to help you understand usage patterns, troubleshoot performance issues, and monitor MCP server health. These metrics offer insights into server usage and help identify potential issues before they affect users.
Key Metrics:
-
Total Requests: Count of incoming requests over time, displayed as a time-series graph. This helps you understand usage patterns, peak times, and overall traffic volume.
-
Error Rate: Percentage of 4xx/5xx HTTP responses across all actions. A high error rate may indicate configuration issues, authentication problems, or bugs in your actions. Monitor this metric to ensure service reliability.
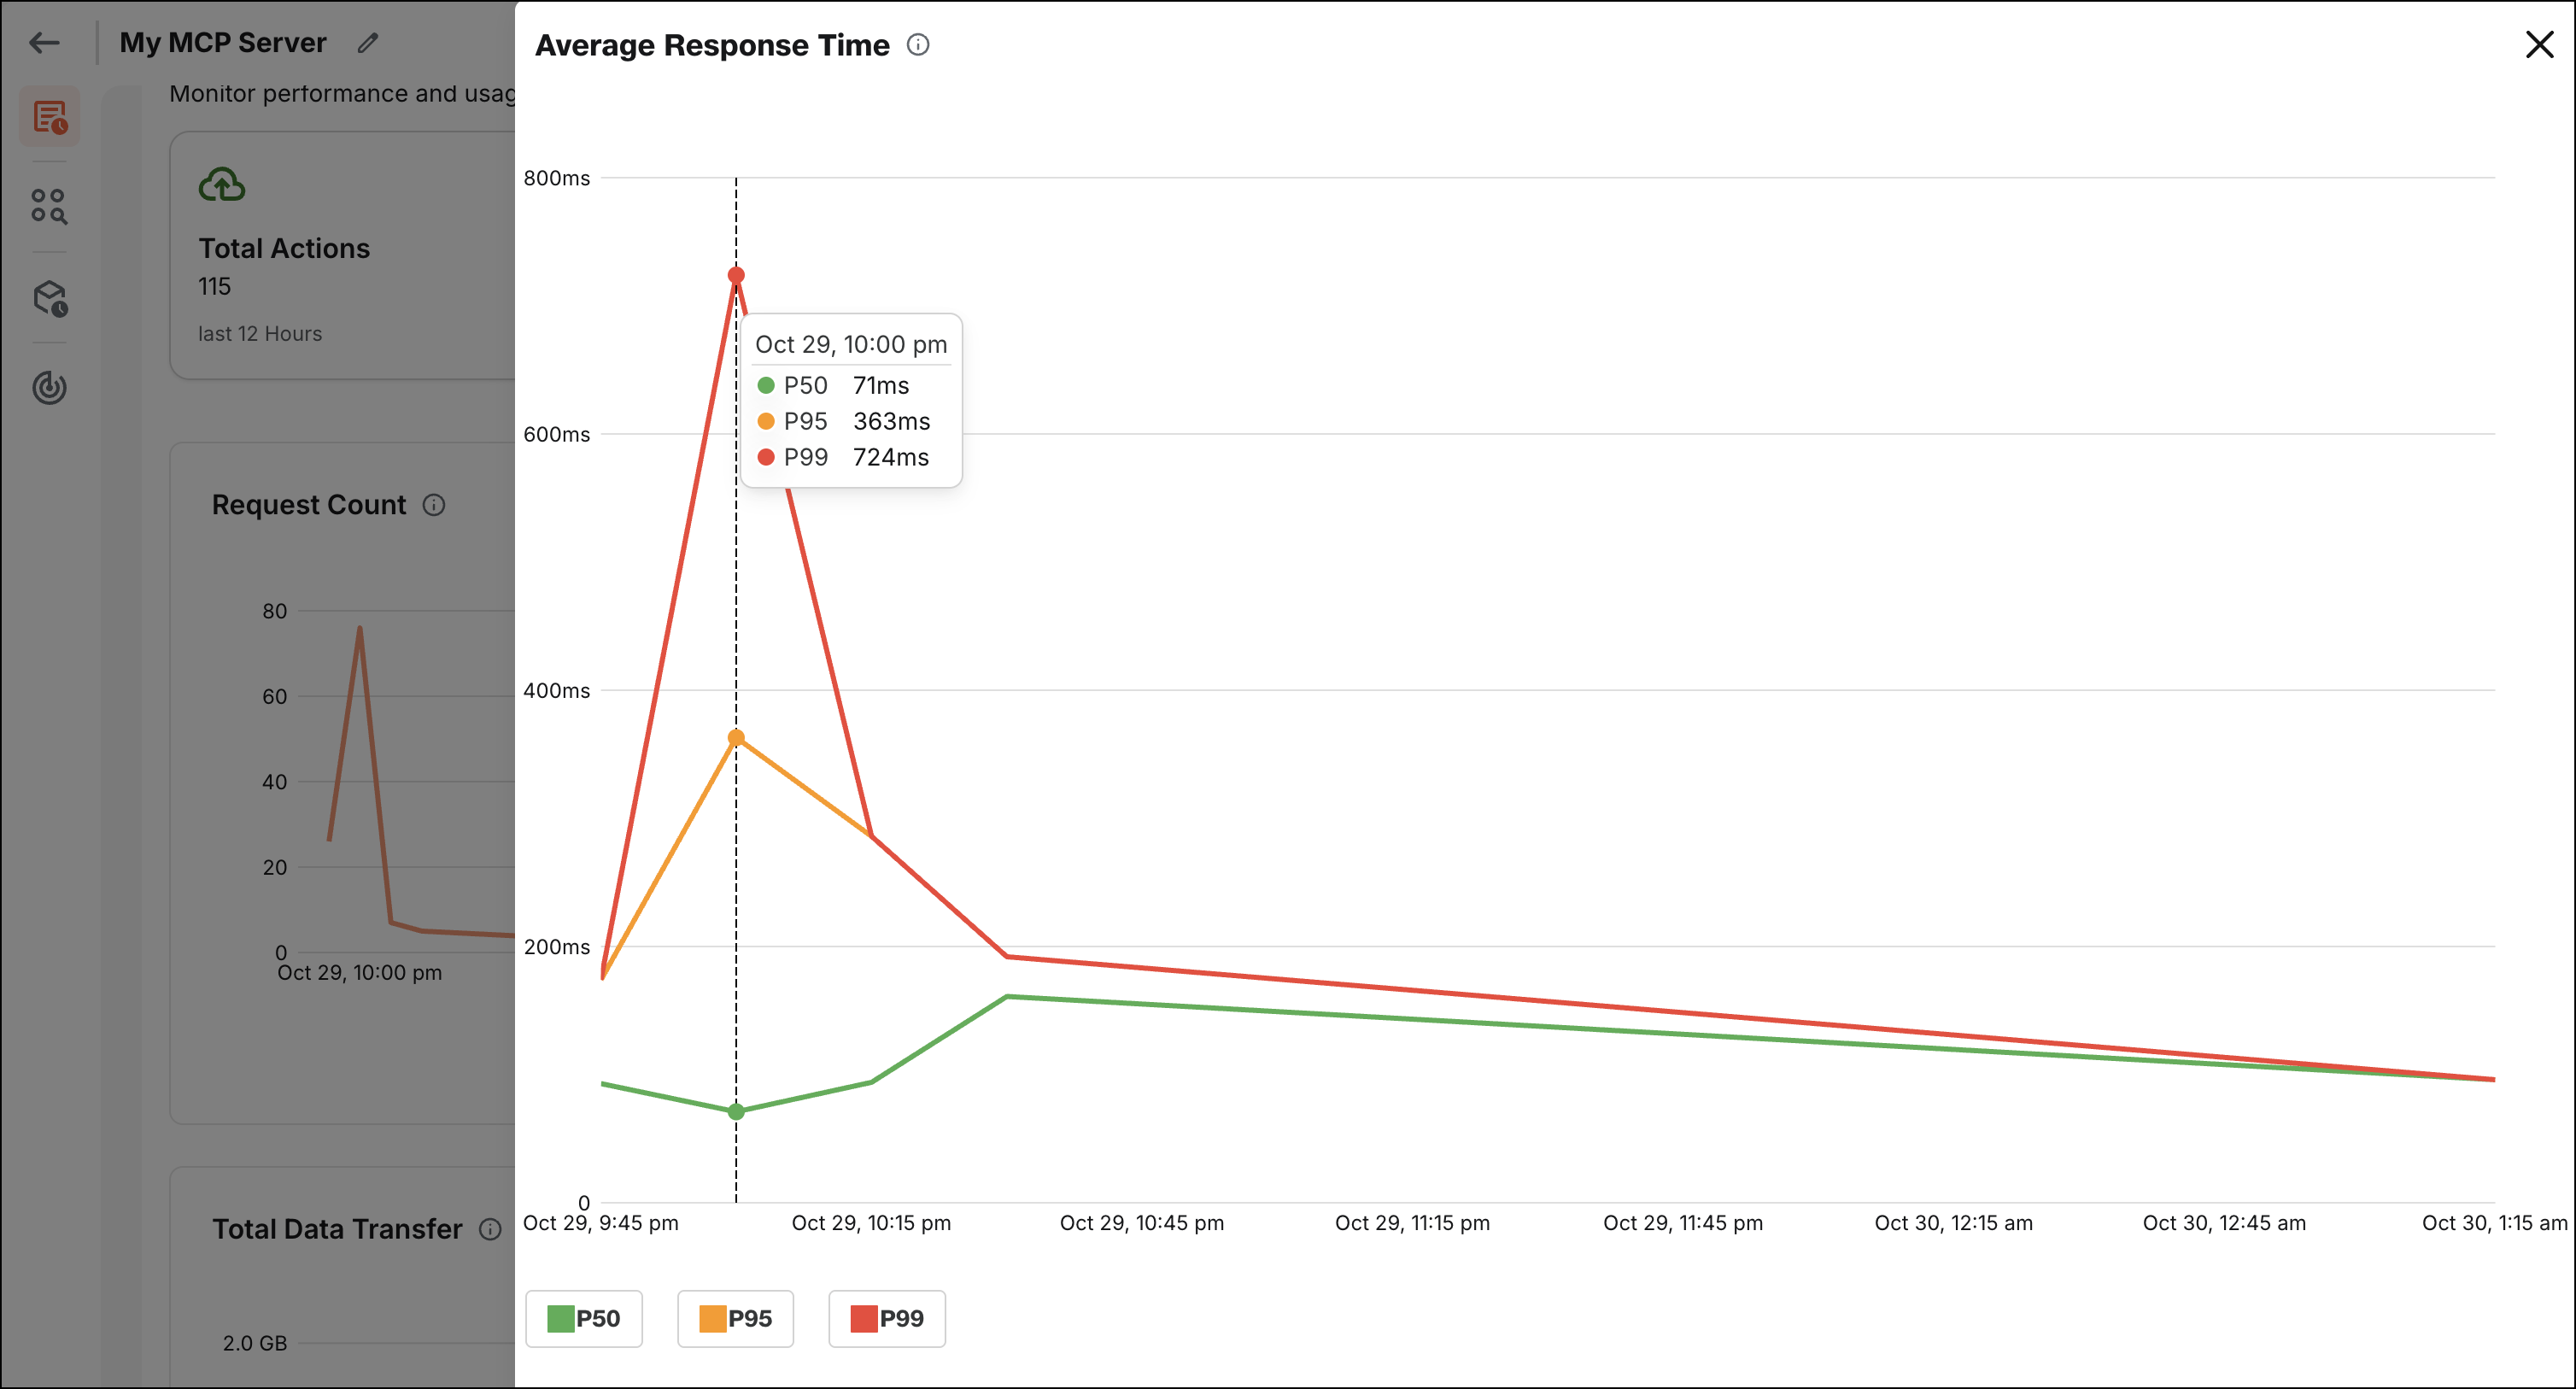
-
Average Action Latency: Average time spent processing requests within Boltic MCP (excluding downstream latency from external APIs or services). This metric helps you identify performance bottlenecks and optimize slow actions.
-
Top Actions by Volume: List of high-traffic actions in your MCP server, sorted by request count. This helps you understand which actions are most frequently used and may need optimization or scaling considerations.
-
Success Rate: Percentage of successful requests versus total requests. This complements the error rate metric to give you a complete picture of service health.
-
Request Distribution: Breakdown of requests by action, method, or client, helping you understand usage patterns and identify potential issues.
Best Practices
Follow these best practices to effectively use logging and monitoring features:
- Regular Monitoring: Audit error rates at the action level to identify failing actions early. Set up alerts for error rate thresholds to receive immediate notifications.
- Request/Response Analysis: Understand the request and response body structure for each action. Review logs regularly to ensure actions use expected parameters and return expected results.
- Performance Optimization: Use latency metrics to identify slow actions and optimize them. Actions with consistently high latency may require optimization or caching.
- Usage Patterns: Analyze usage patterns to understand peak times, most-used actions, and user behavior. This information can help with capacity planning and feature prioritization.
- Error Investigation: When errors occur, use the detailed log information to investigate root causes. Review error messages, request parameters, and response bodies to understand what went wrong.
- Security Monitoring: Monitor logs for unusual patterns, unexpected parameter values, or suspicious activity that might indicate security issues.
- Documentation: Update documentation based on usage patterns observed in logs. If AI models consistently misunderstand how to use an action, revise descriptions and schemas as needed.
With comprehensive logging and monitoring, Boltic MCP enables users to maintain high reliability, quickly diagnose issues, and continuously optimize MCP server performance.